Sandwell and the English Indices of Deprivation 2019
Sandwell's Index of Multiple Deprivation 2019 Ranking
The English Indices of Deprivation 2019 is an official measure of deprivation. The indices provided relative data for small areas and summaries for local authorities. It updates previous versions published in 2015, 2010, 2007, 2004 and 2000.
Indices of Multiple Deprivation 2019 - District Level
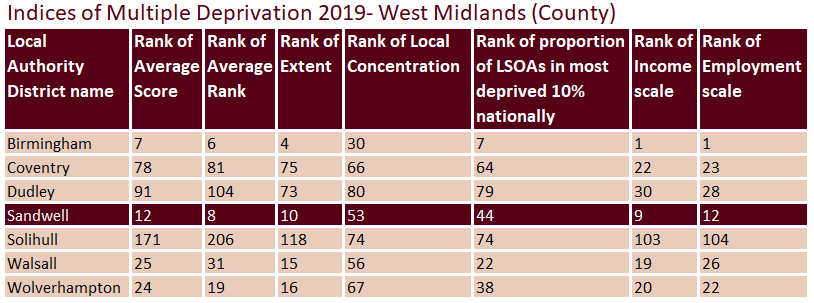
Sandwell’s average deprivation score has declined slightly since 2015, falling one place to become the 12th most deprived local authority out of a total of 317 (where 1 is the most deprived). However, this does not necessarily mean that deprivation in the borough has declined – only that it has declined relative to other areas. Sandwell's neighbour Birmingham is among the 10 most deprived Local Authorities by average score (ranked 7th).
The table below shows that Birmingham is worst in the West Midlands on all indicators, as the most deprived local authority in the conurbation. On most measures Sandwell is the most deprived local authority within the Black Country. The relatively high ranking on extent compared with a lower ranking on local concentration reveals that Sandwell's deprivation is spread across the borough rather than being concentrated in certain hotspots.

Indices of Multiple Deprivation 2019 - Deprivation at Local Level in Sandwell
The map below shows the distribution of deprivation across the borough at the smallest available geography - Lower Super Output Area (or LSOA - small areas with around 1,000 to 2,500 residents in the 2011 Census) and shows which of the ten national deciles (10% bands) the 186 Sandwell LSOA fit into. The darker the shade, the more deprived the LSOA - although deprivation can vary within an LSOA.
Large areas of Smethwick, Tipton, Wednesbury and West Bromwich are heavily deprived. The less deprived Sandwell areas are represented by lighter shades and can be seen in the north east of West Bromwich, and the peripheries of Smethwick, Oldbury and Rowley Regis.
Sandwell and the English Indices of Deprivation 2019
What are the Indices of Deprivation?
The English Indices of Deprivation is an official measure of deprivation, published by the Ministry of Housing, Communities and Local Government (MHCLG). The most recent, the Index of Deprivation 2019, published September 2019, updates previous versions published in 2015, 2010, 2007, 2004 and 2000.
They attempt to measure a broad concept of 'multiple deprivation' using a basket of indicators across 7 'domains' of deprivation. These domains are:
They are then combined, using appropriate weights, to calculate an overall measure of 'multiple deprivation'. The results are published at local authority and Lower Super Output Area (LSOA) level. There are 186 LSOAs in Sandwell, each containing between 1,095 and 2,757 people in the 2011 Census. Each LSOA is given a score for each domain. This is then used to rank all 32,844 LSOAs in England, with the most deprived being ranked as 1. It is a relative measure, placing areas in a position relative to each other.
In addition, there are two indices relating specifically to children and older people:
Further Information:
Further information is available on the Gov.uk website: English indices of deprivation 2019
(Ministry of Housing, Communities & Local Government)
