Ethnic Group & Language

  • In 2021, 57.3% (195,620) of usual residents in Sandwell identified their ethnic group within the high-level "White" category, compared with 81.7% in England & Wales. Sandwell has seen a decrease from 69.9% in the 2011 Census.
  • As part of the "White" ethnic group, 52.1% (177,930) of the total population in Sandwell identified their ethnic group as "English, Welsh, Scottish, Northern Irish or British" (compared with 74.4% in England & Wales), this is a continued decrease from 65.8% in 2011, and from 78.0% who identified this way in 2001.
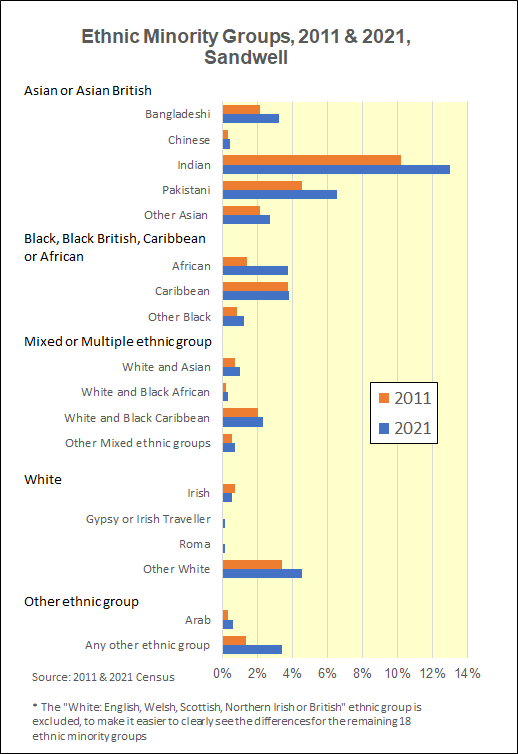
  • The next most common high-level ethnic group was "Asian or Asian British" accounting for 25.8% (88,020) of the overall population, this ethnic group also saw the largest percentage point increase from 2011, up from 19.2% (59,260 people).
  • Across the 19 ethnic groups, large changes were seen in the numbers of people identifying their ethnic group as "Other ethnic group: Any other ethnic group" (3.4%, 11,710 in 2021, up from 1.3%, 3,880 in 2011), and " Black, Black British, Caribbean or African: African" (3.7%, 12,670 in 2021, up from 1.4%, 4,400).
  • In Sandwell, 10.6% (13,840) of households consisted of members identifying with two or more different ethnic groups, an increase from 9.1% (11,035) in 2011.
  •  

    Where respondents selected they identified as one of the “other” ethnic groups within each broad category, they were able to write in their ethnicity. This has enabled ONS to produce a detailed ethnic group classification, providing insight for 287 ethnic groups.

  • In Sandwell, the largest of these groups in 2021 are “Sikh”, accounting for 2.3% of the population, and “Polish” (1.7%).
  •  

    In 2021, 83.6% (274, 710) of Sandwell usual residents, aged three years and over, had English as a main language, compared with 91.1% in England & Wales. The Sandwell figure is down from 88.0% in 2011.

  • In 2021, a further 5.2% (17,230) of the overall population were proficient in English (saying they speak it very well) but did not speak it as their main language.
  • The most common main languages spoken in Sandwell, other than English were: Panjabi (6.4%), Polish (1.7%), Bengali (1.0%) and Urdu (1.0%).
  • The largest increase was for people who specified Punjabi as a main language, who accounted for 6.4% (20,980) of usual residents in 2021, up from 4.3% (12,520) in 2011.
  • In 2021, 11.3% (14,750) of households consisted of members who had different main languages.
  • Country of Birth & National Identity

  • In 2021, almost one in four (23.6%) usual residents of Sandwell were born outside the UK, compared with one in six nationally. This proportion puts Sandwell in the top 50 Local Authorities across England & Wales. In 2011, 15.9% of Sandwell residents were born outside the UK.
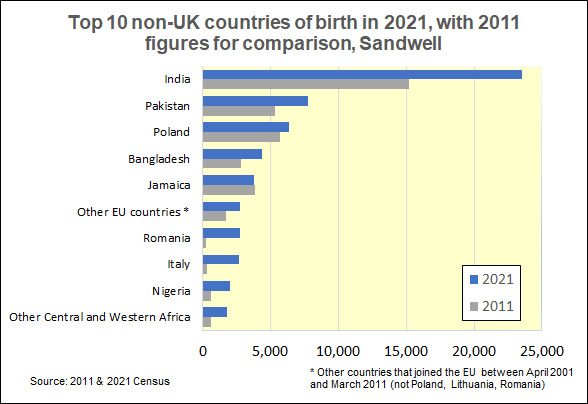
  • India remained the most common country of birth outside the UK in 2021 (23,530 people, 6.9% of all usual residents). Relatively large proportions of Sandwell residents were born in Pakistan (2.3%) and Bangladesh (1.3%).
  • The number of people who were born in Poland grew by 12.5% since the previous census, from 5,670 in 2011 to 6,380 in 2021. The number born in Romania rose by almost 1200%, from 210 in 2011 to 2,710 in 2021.
  • 47,670 usual residents (13.9%) held a non-UK passport; one of the most common non-UK passport held was Polish (6,860, 2.0% of all usual residents).
  • 2,620 usual residents (0.8% of the population) had an address outside the UK one year before the census, up 11.4% from 2,350 (0.8%) in 2011.
  •  

    In 2021, 84.6% of Sandwell usual residents identified with at least one UK national identity (English, Welsh, Scottish, Northern Irish, British, and Cornish); this compares with 90.3% in England & Wales.

  • People who identified with at least one UK and one non-UK identity accounted for 1.6% of the overall population, compared with 2.0% in England & Wales.
  • Those selecting a non-UK identity accounted for 13.5% of the overall population (46,170), compared with 9.7% nationally.
  • Among those who described a non-UK national identity, the most common response was those describing “Indian” only as their identity (3.1%, 10,600).
  • “Polish” only was the second most commonly reported non-UK national identity in Sandwell (1.6%, 5,540), and “Italian” the third (1.3%, 4,570).
  • Religion

  • The religion question is voluntary; 94.6% of Sandwell’s usual residents answered the question in 2021, an increase from 93.9% in 2011.
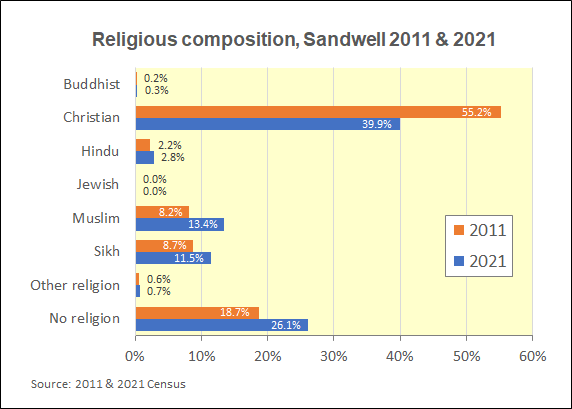
  • For the first time in a census of England and Wales, less than half of the population (46.2%) described themselves as “Christian”, a 13.1 percentage point decrease from 59.3% in 2011. This pattern was mirrored in Sandwell, where 39.9% (136,350) residents described themselves as “Christian” in 2021, compared with 55.2% (170,075) in 2011. Despite this decrease, “Christian” remained the most common response to the religion question.
  • “No religion” was the second most common response in Sandwell, increasing by 7.4 percentage points to 26.1% (89,100) from 18.7% (57,720) in 2011.
  • There were increases in the number of people who described themselves as “Muslim” (45,760, 13.4% in 2021, up from 25,250, 8.2% in 2011) and “Sikh” (39,250, 11.5% in 2021, up from 26,930, 8.7% in 2011).