Population Change

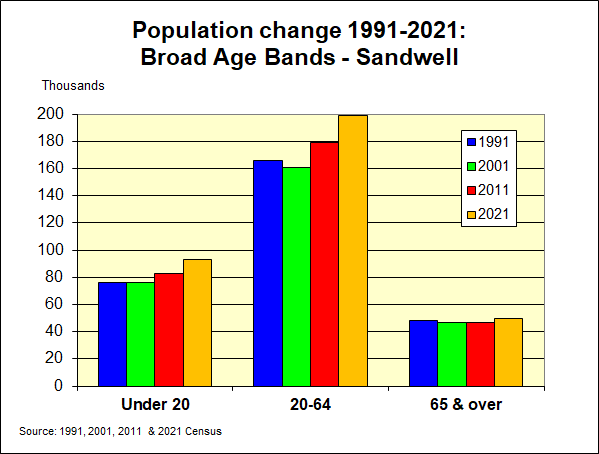
The 2021 Census estimates that Sandwell has 341,900 residents, a rise of 11.0% since 2011. This compares with a rise of 6.3% in England and Wales. The previous Census in 2011 saw a reverse of the declining population trend experienced since 1971. The latest Census sees the population of Sandwell growing to an even higher level than that in 1971.

  • The 11% rise in Sandwell since 2011 is the highest in the West Midlands Metropolitan County area, the next highest being in Coventry (8.9%). The county and the region overall have seen rises similar to the national growth.
  • Of the 341,900 residents in Sandwell in 2021, 168,200 are male and 173,600 are female.
  •  

    There are now 130,200 households in Sandwell, compared to 121,500 in 2011 - a rise of 7.2%.

  • The population density in Sandwell stands at 3,996 people per square kilometre in 2021, compared to 3,600 in 2011.
  •  

    Population data by ward can be viewed here.
    Population Structure

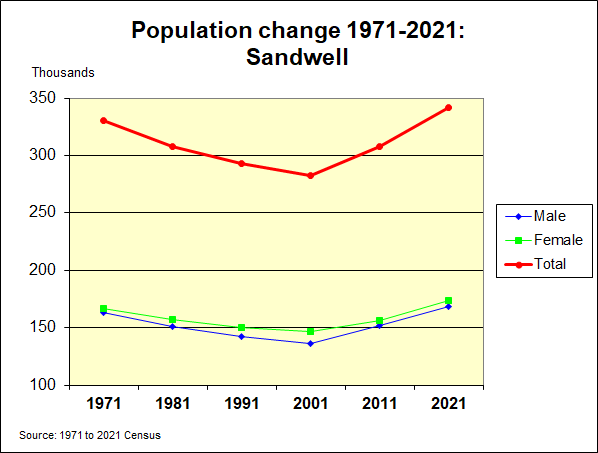
    Sandwell’s population in terms of broad age bands is shown in this graph.

  • Between 1991 and 2001, the actual numbers of over 65s in Sandwell fell. However, there has been an increase since 2001, and people over pensionable age now make up 14.5% of all residents, compared with 16.5% in 2001.
  • The proportion of the population aged 20 to pensionable age has risen by 11.2%, and now makes up 58.2% of Sandwell's population, a rise from 56.8% in 2001.
  • The number of under 20s has been steadily rising since 2001, with a 13.1% increase between 2011 and 2021.
  •  

    In terms of 5 year age-bands, the largest increases have been amongst those aged 55 to 59 (+34.2%) and 50 to 54 (+28.4%).

  • Two other age groups have also seen rises of over 20% - 10 to 14 years (+26.2%) and 5 to 9s (+21.8%).
  • There have been slight falls in the numbers in a few age groups -  25 to 29s, 4 & under, and 20 to 24s (-2.5%, -2.1% & -1.9% respectively).
  •  

    You can download the 2021 Sandwell & England data by age and gender here.

    The pyramid shows the population structure of Sandwell in 2021, compared with England. As you can see, the population structure of Sandwell is much younger than England overall.
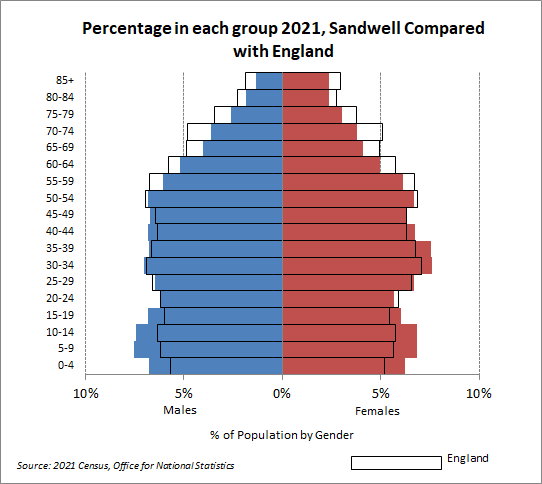
  • There is a larger proportion of the population aged under 20 in Sandwell.
  • The proportion aged 30 to 49 is also much larger compared to England.
  • The proportion of the population aged 50 and over in England is much larger than in Sandwell, particularly in the 65-69 and 70-74 age groups.
  • Gender Identity

    Gender identity refers to a person’s sense of their own gender, whether male, female or another category such as non-binary. This may or may not be the same as their sex registered at birth.

    The question on gender identity was new for Census 2021. It was added to provide the first official data on the size of the transgender population in England and Wales, and was a voluntary question asked of those aged 16 years and over. The question asked “Is the gender you identify with the same as your sex registered at birth?”.

  • Nationally, 45.7 million (94.0% of the population aged 16 years and over) answered the question. In Sandwell, this fell to 92.6% (meaning 7.4% did not answer the question).
  • In total, 244,450 (91.9%) of Sandwell residents answered “Yes” and 1,970 (0.7%) answered “No”.
  • Among those who answered “No” in Sandwell:

  • 1,150 (0.4%) answered “No” but did not provide a write-in response
  • 350 (0.1%) identified as a trans man
  • 360 (0.1%) identified as a trans woman
  • Sexual Orientation

    Sexual orientation is an umbrella term covering sexual identity, attraction, and behaviour. For an individual respondent, these may not be the same. For example, someone in an opposite-sex relationship may also experience same-sex attraction, and vice versa. This means the statistics should be interpreted purely as showing how people responded to the question, rather than being about whom they are attracted to or their actual relationships.

    The census question on sexual orientation was a voluntary question asked of those aged 16 years and over.
  • Nationally, 44.9 million people (92.5% of the population aged 16 years and over) answered the question. In Sandwell this fell to 91.6% (meaning 8.4% did not answer the question).
  • In Sandwell, 237,540 people (89.3%) identified as straight or heterosexual.
  • Around 6,100 people (2.3%) identified with an LGB+ orientation (“Gay or Lesbian”, “Bisexual” or “Other sexual orientation”).
  • Veterans

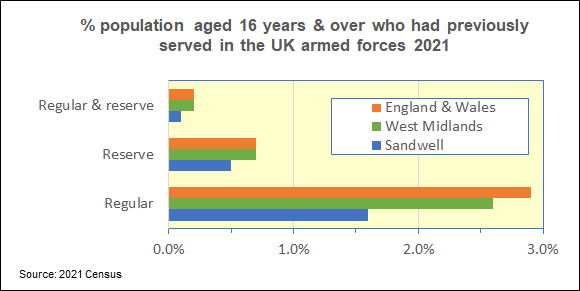
  • In 2021, 5,844 people in Sandwell reported that they had previously served in the UK armed forces (2.2% of usual residents aged 16 years and over). This compares with 3.8% in England & Wales.
  • Of the UK armed forces veterans in Sandwell, 72.3% (4,224 people) previously served in the regular forces, 23.5% (1,375 people) in the reserve forces, and 4.2% (244 people) served in both the regular and reserve forces.
  • 2% of Sandwell armed forces veterans lived in households (rather than communal establishments).
  • There were 5,644 Sandwell households (4.3%) with one or more persons who had served in the UK armed forces, compared with 6.5% in the West Midlands Region.