Age-standardised proportions (ASPs) are used throughout this section; ASPs allow for comparison between populations over time and across geographies, as they account for differences in the population size and age structure.
In Sandwell, 20% of residents were disabled under the Equality Act, compared with 17.8% in England & Wales. 9.9% of Sandwell residents were disabled and said their disability limits their day-to-day activities a lot.
27.4% of Sandwell households included 1 disabled person (25.6% in England & Wales), whilst 8.3% of households contained 2 or more disabled people (6.7% in England & Wales). [Please note this is not age-standardised]
In Sandwell almost 30,000 usual residents aged 5 years and over provided unpaid care in 2021, this is an ASP of 9.9%, compared with 9.0% in England & Wales.
5% of usual residents aged 5 years and over provided 50 or more hours unpaid care a week.
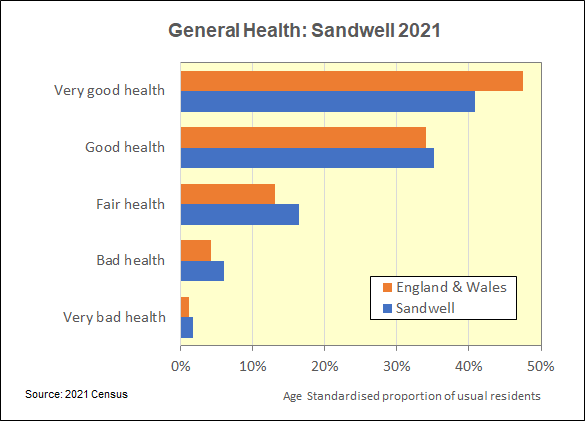
In Sandwell, 40.8% of people reported very good health, compared with 47.5% in England & Wales.
8% reported bad or very bad health (5.4% in England & Wales).

